Start with the action buttons at the top
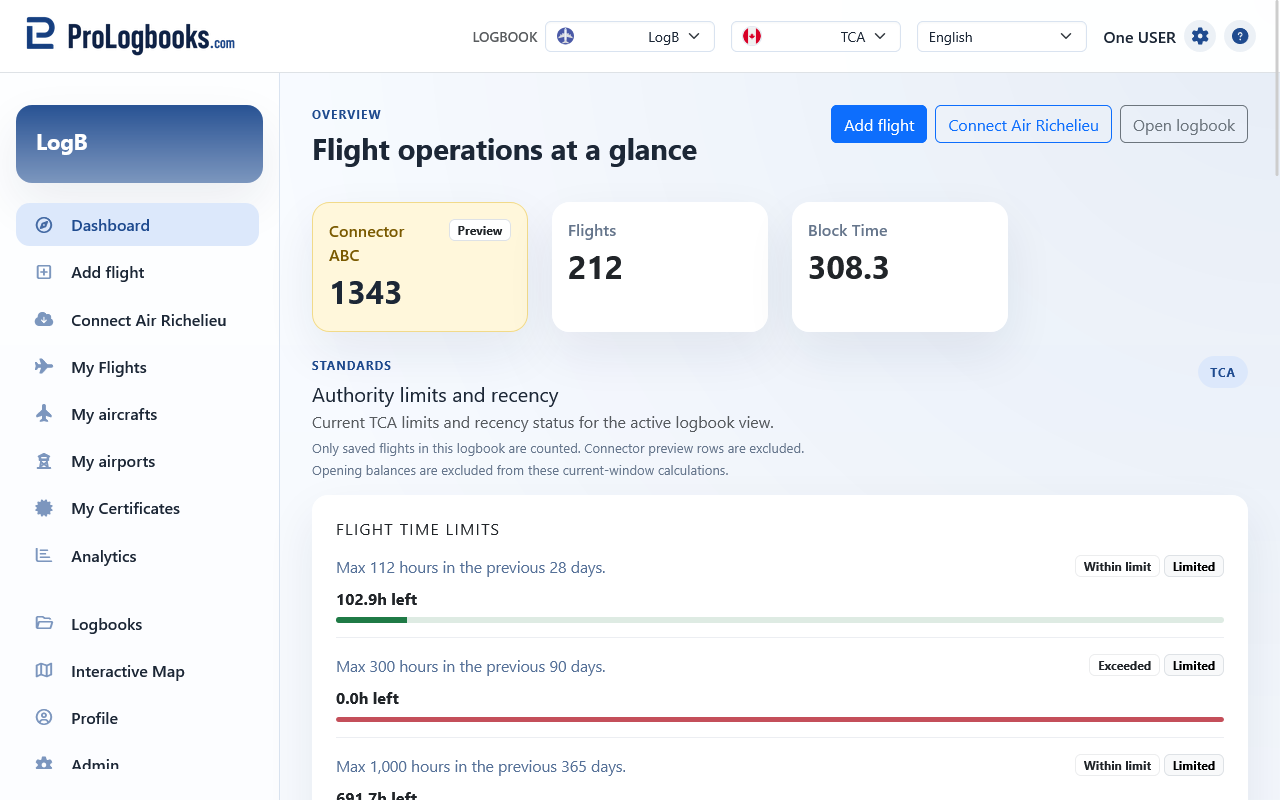
At the top of the dashboard, the main buttons take you directly to the most common actions. Add flight opens the flight entry form for the current logbook, and Open logbook takes you to the full flight list.
If your current logbook is linked to a connector, an additional connector button appears. Use it when you want to review imported or pending connector flights before they become part of your final records.
Read the summary cards and recent flights table
The summary cards show the number of flights and the accumulated block time for the current logbook. These totals help you confirm that your latest entries were saved in the right place.
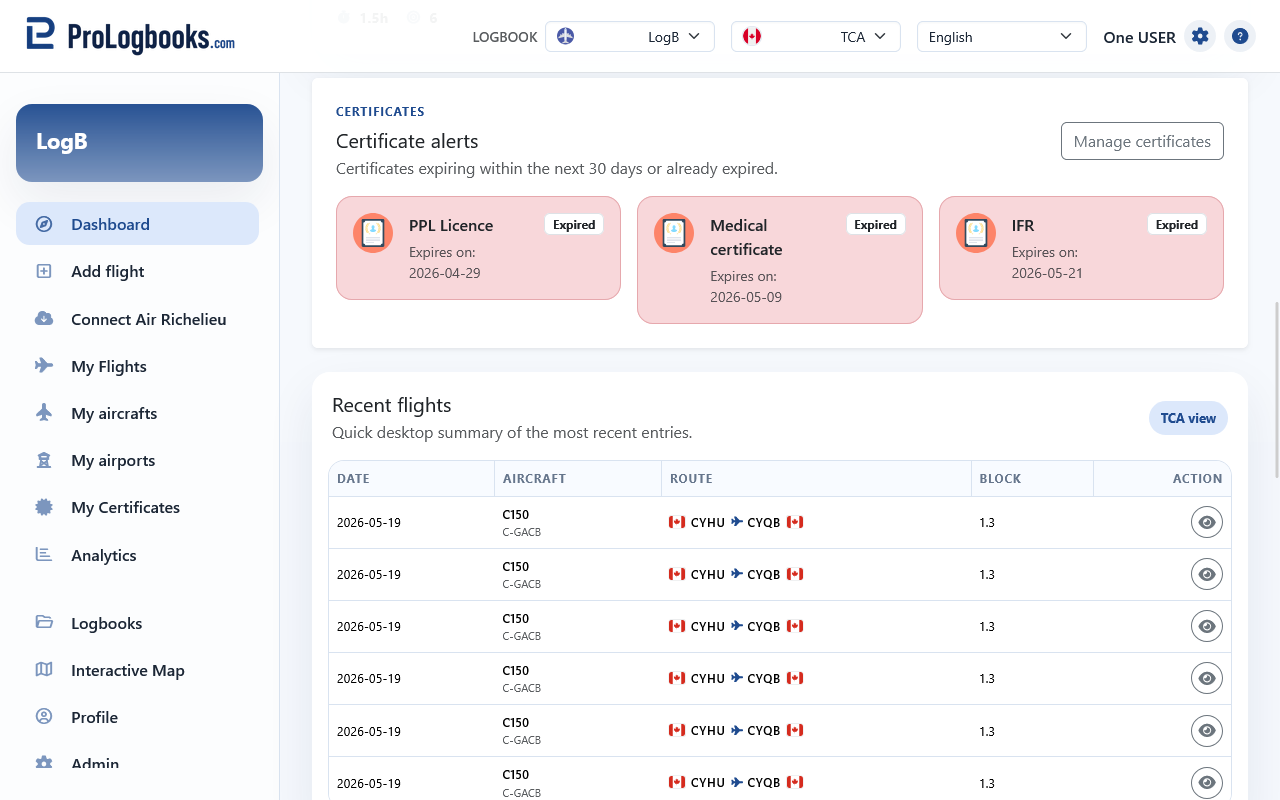
Lower on the page, the Recent flights table shows the latest saved flights with the date, aircraft, route, and block time. Use the open button at the end of a row when you want to inspect one record in detail.
- If the recent flights table is empty, the current logbook does not contain saved flights yet.
- The view badge beside the recent flights heading shows which regulatory layout is currently active.
Watch the certificate alerts and regulatory view card
If certificates are close to expiry or already expired, the dashboard shows alert cards. Expiring certificates display the number of days left, and expired certificates display an expired status badge.
The regulatory view card lets you switch between the configured views such as EASA, FAA, or Transport Canada. Switching the view changes how the same saved data is presented throughout the workspace.
The Flight time limits and Recency cards are also navigation shortcuts. When you click either card, the system opens Analytics and jumps to the matching authority section so you can review that group in more detail.
If something goes wrong
- If the dashboard opens but the numbers look wrong, first confirm that the correct logbook is selected in the top workspace picker.
- If the connector card does not appear, the current logbook may not be linked to a connector or your plan may not include connector access.
- If a certificate alert is missing, open Certificates and confirm that the document belongs to the current logbook and has a valid expiry date.